Background
Slowly has removed locations in their API to fetch data of friends. Instead, rough locations modified slightly at the server side are returned in an API(/letter/incoming) to fetch incoming letters. Based on my tests, the locations would change each time when the API is requested, and one of the returned locations can differ from the one that is not modified with a max distance of nearly 30km.
The thought of restoring the accurate location is to send requests and collect as many locations as possible, from which we may luckily discover a pattern or strategy of how these locations are generated.
Steps
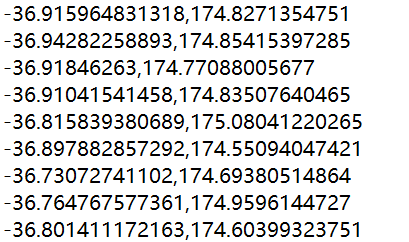
To know the exact location and do the comparison, I created another account and sent a letter to my main account. It’s quite easy to extract the accurate location of yourself.
After signing in my main account, I could see a letter from the newly created account was arriving. I modified some code to send requests repeatedly for 5000 times and wrote these location data to a text file with one location in a row.
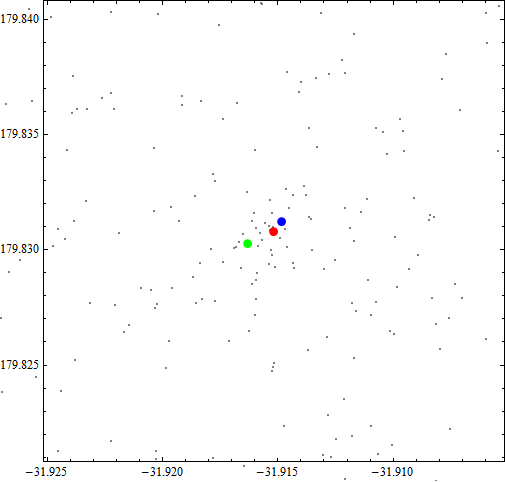
Next, I chose to use Mathematica to draw all these points and the pattern revealed itself. The first graph contains 1000 points, and the second one contains 5000 points.
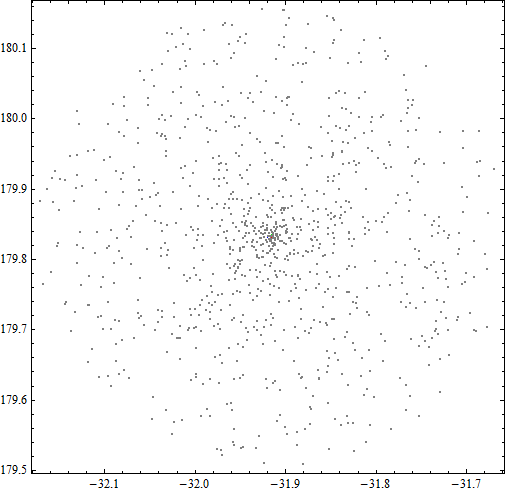
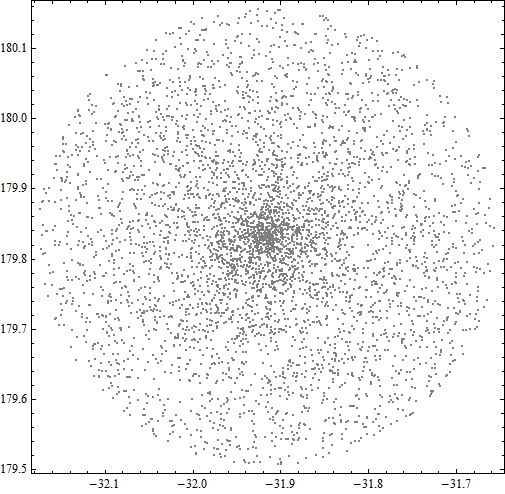
These locations are modified under a limitation of a certain distance and hence enough of them would form a shape of circle. What we need to do next is finding out the center of the circle. One way is to calculate the average value of longitudes of the leftmost point and the rightmost one as the longitude of the center. Applying this method to the vertical side we can get the latitude as well. Another way is calculating the average value of all points on both vertical and horizontal orientation, and this should be more accurate theoretically if the number of points is large enough.
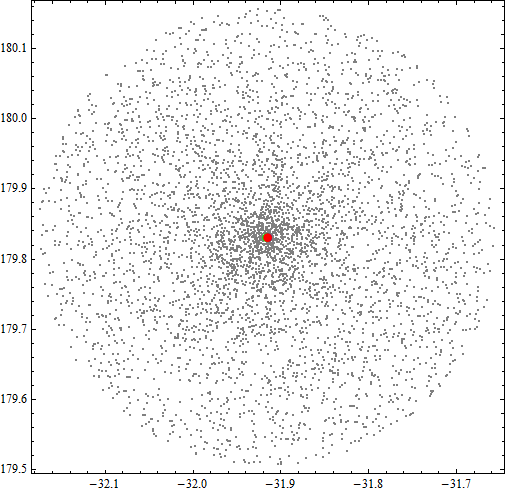
In the graphs shown below, the red points indicate the exact location, the blue points indicate the center location calculated from method one, and the green points represent method two.
Conclusion
In those graphs, the blue points are pretty close to the red points and the numerical difference of them is {0.000347611, 0.000399408}, which is less than 50 meters on a map.
Of course, there is no way to get the exact locations, but with this method, we can get a relatively accurate answer.